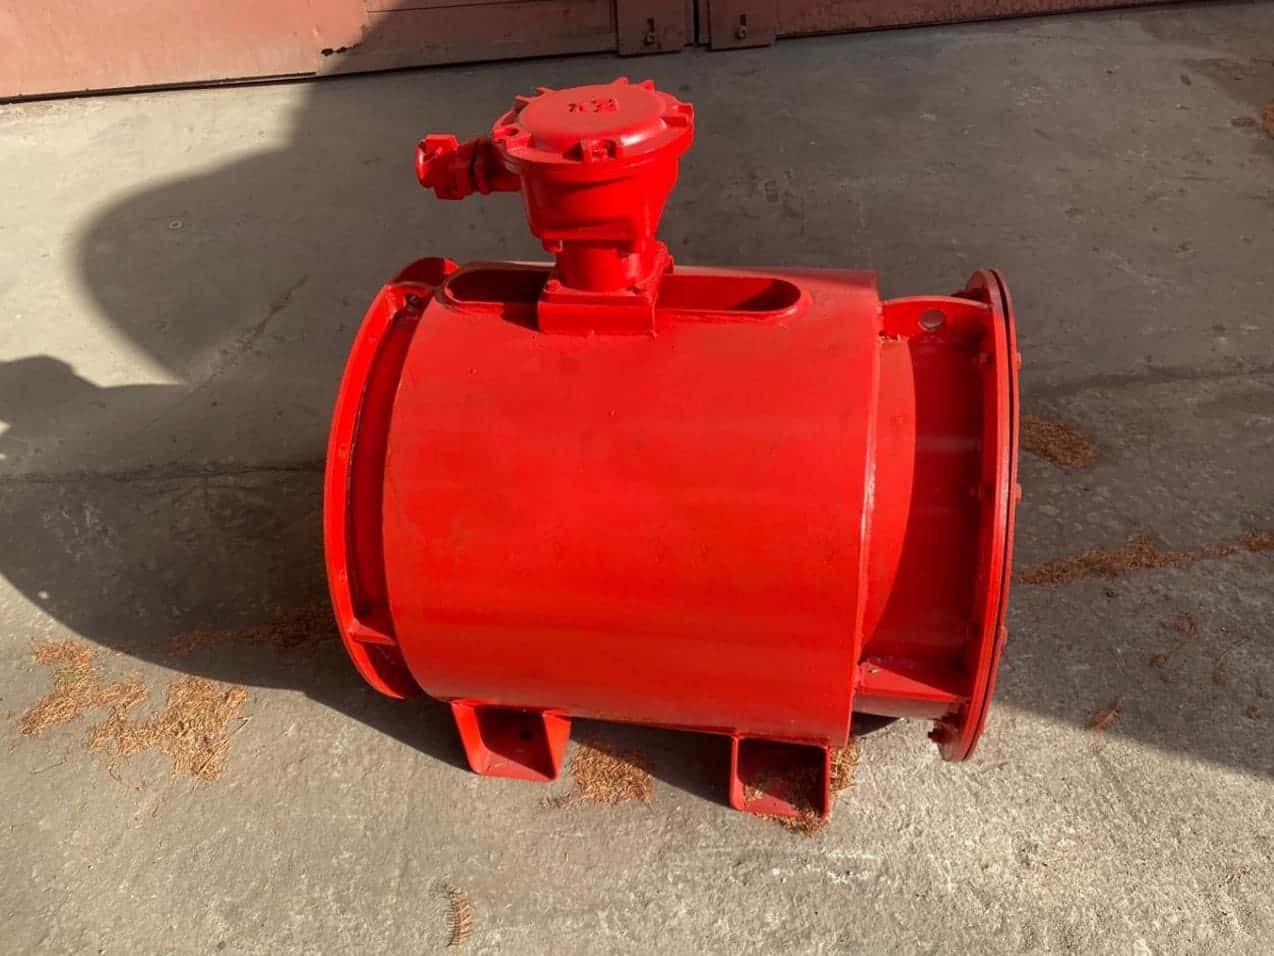
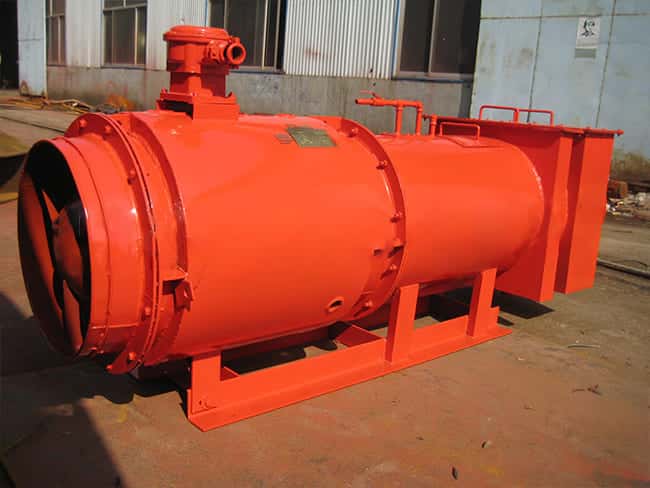
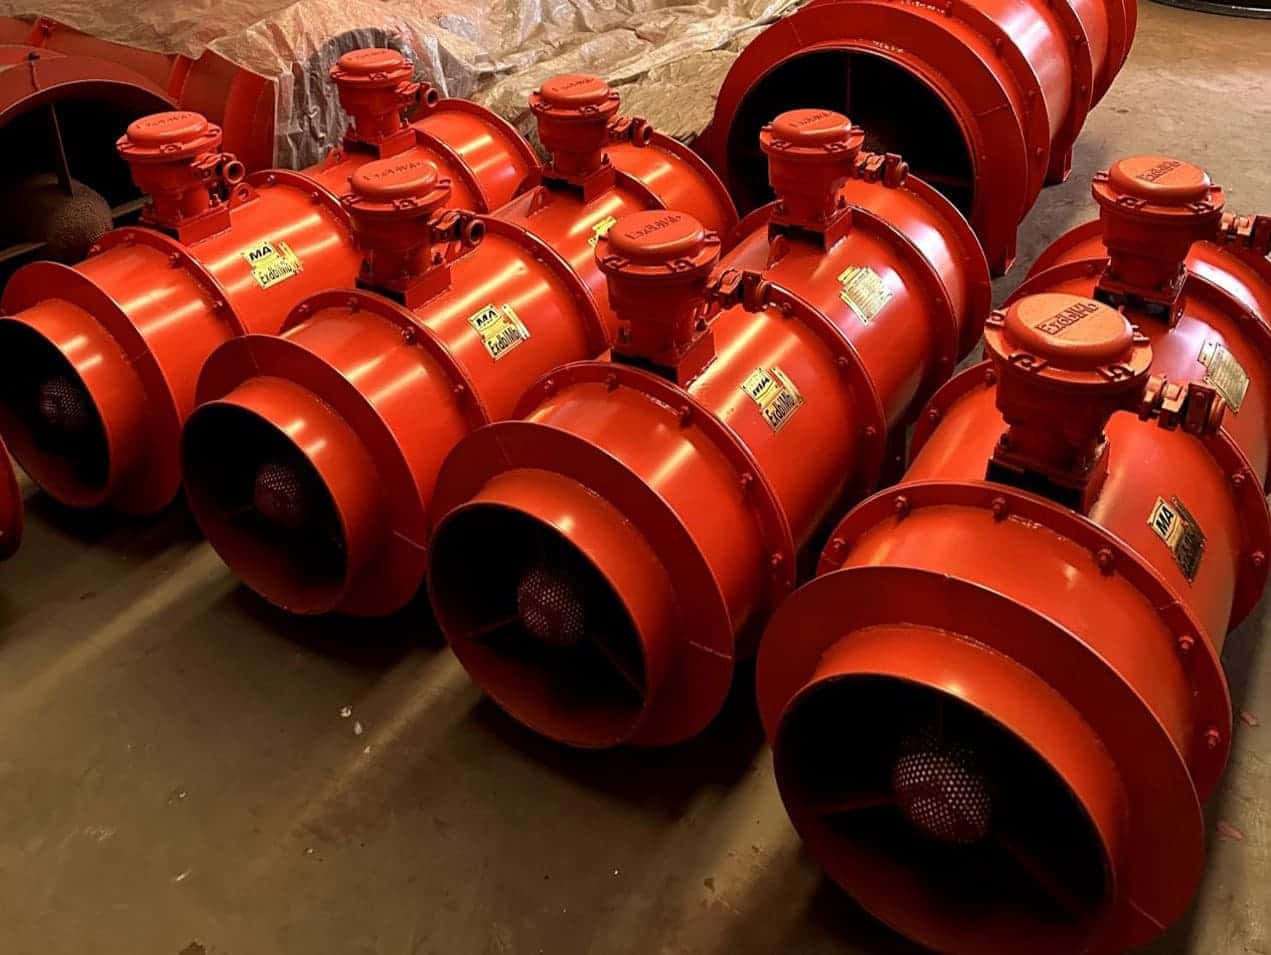
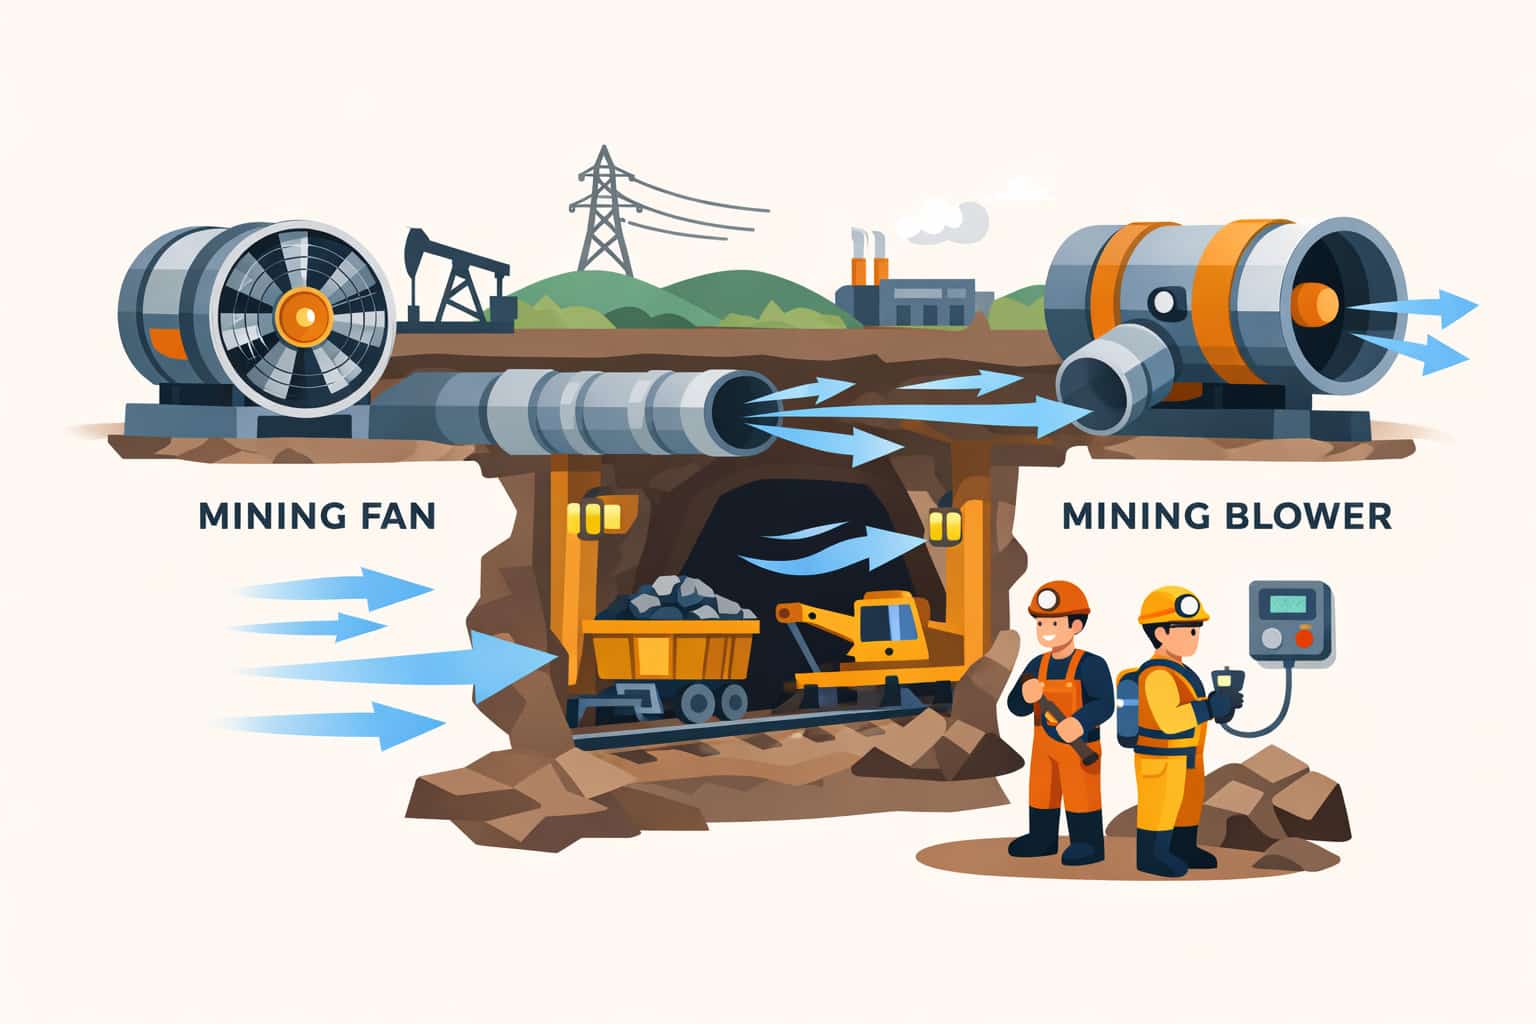
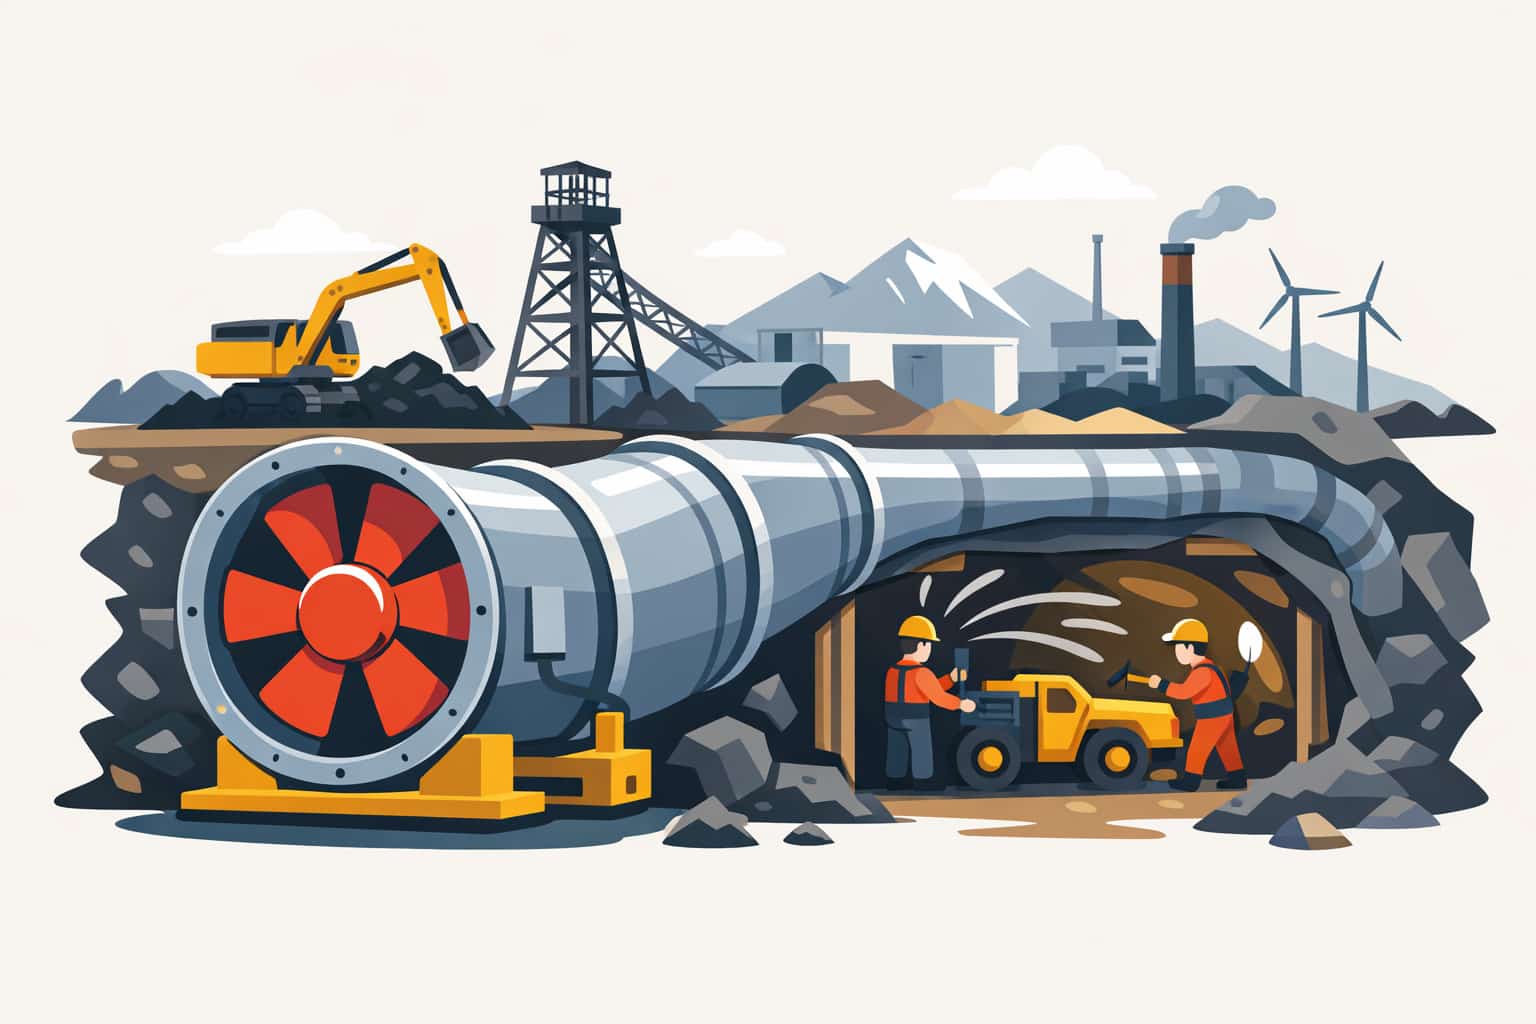


Drawing a fan curve means turning fan performance data into a graph that shows how airflow and pressure are related at a given speed. Fan curves are a basic tool in industrial and mining ventilation design, because they let you see how a fan will behave as system resistance changes.
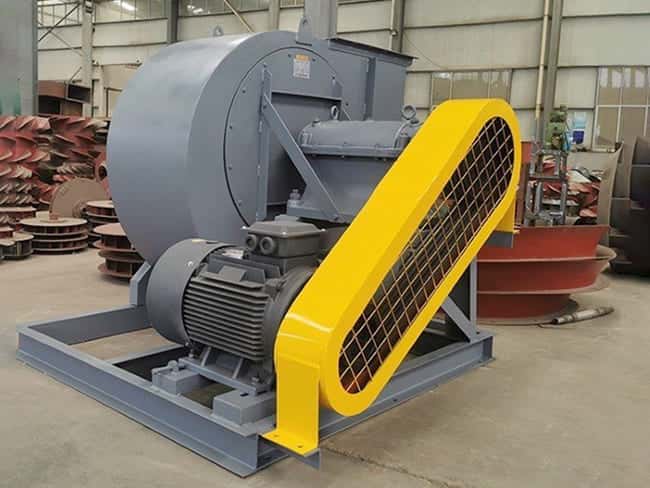
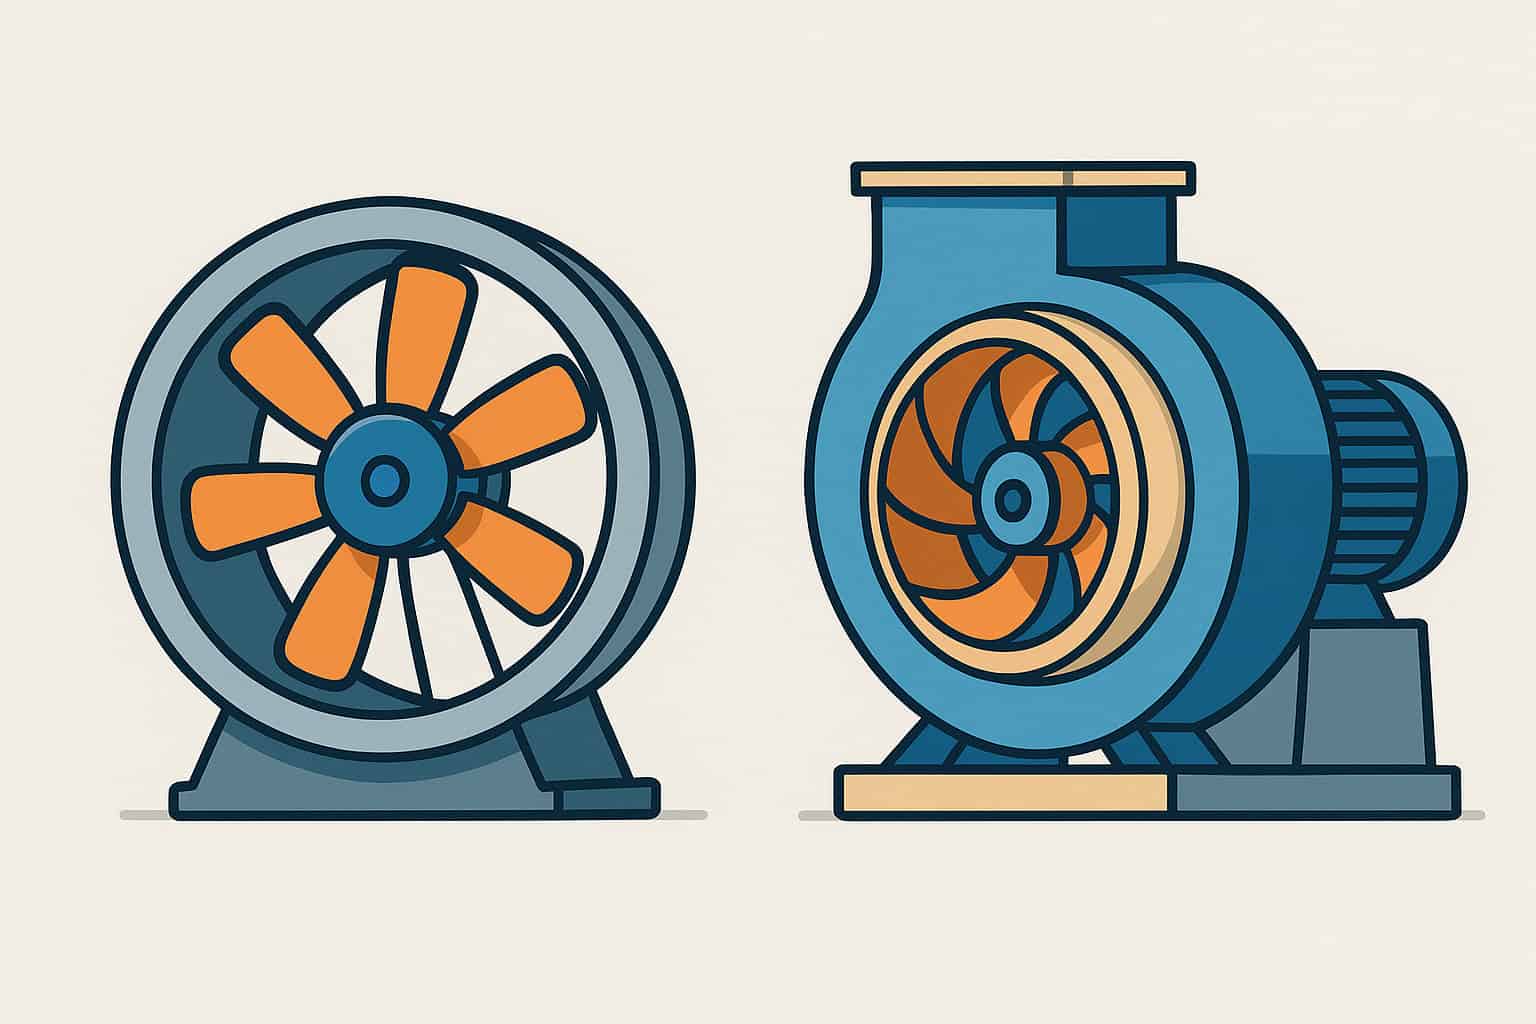
In most projects, you do not test the fan yourself; you use manufacturer performance data. For a specific fan diameter, blade angle and speed, the manufacturer provides tabulated values of airflow (Q), total or static pressure (P), efficiency and power. To draw the fan curve, you choose a coordinate system with airflow on the horizontal axis and pressure on the vertical axis.
You then plot the airflow–pressure pairs from the data table as points on the chart. Connecting these points smoothly gives the main fan curve, showing how pressure falls as airflow increases. Many engineers also add additional curves on the same chart: one for fan efficiency and one for brake power, both as functions of airflow. These extra curves help you identify the best efficiency point and the expected power draw at your design duty.
In a more advanced setting, such as a fan test laboratory, the curve is constructed from measured test data. The fan is operated at constant speed and different resistances are applied using dampers or test ducts. At each setting, airflow and pressure are measured. Those measurements are then corrected to standard air density and plotted in the same way to produce a certified fan curve. This process is governed by industry standards so that results from different suppliers are comparable.
Once you have a fan curve, you can overlay a system curve that represents pressure loss in the ductwork, equipment or mine airways. The intersection point of the fan and system curves shows the expected operating point. If that point is too far from the fan’s best efficiency region, you may need to change fan size, speed or the system design to achieve better performance.
In summary, drawing a fan curve involves plotting airflow on the horizontal axis and pressure on the vertical axis using either manufacturer data or test measurements, then optionally adding efficiency and power curves. This graph is a key tool for matching industrial and mining fans to real ventilation systems.