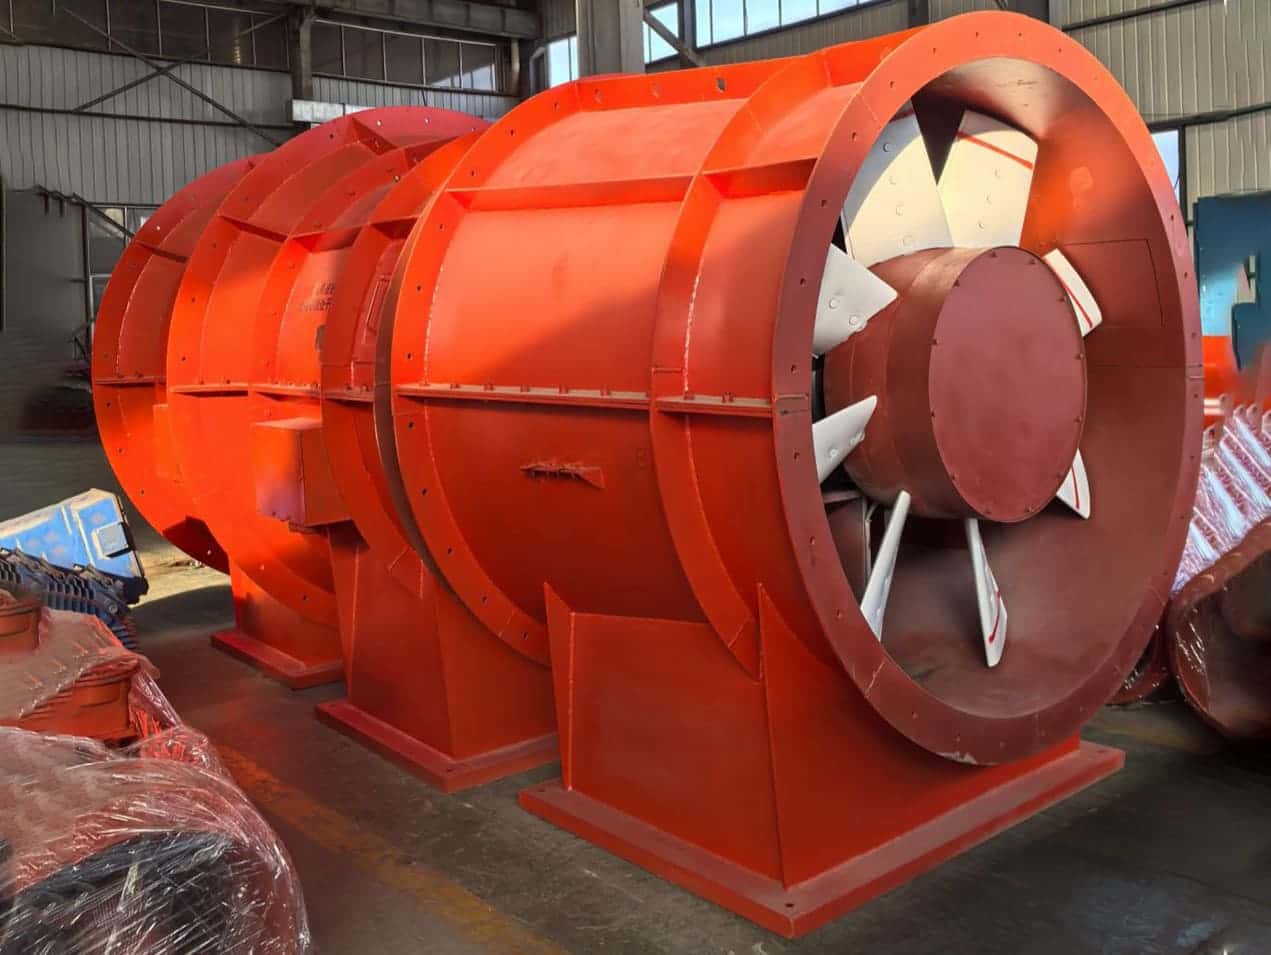
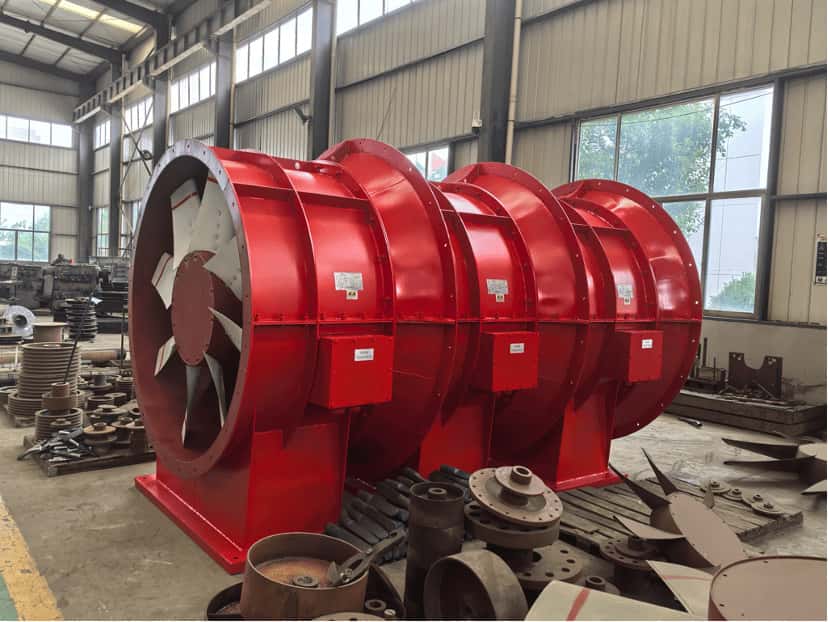


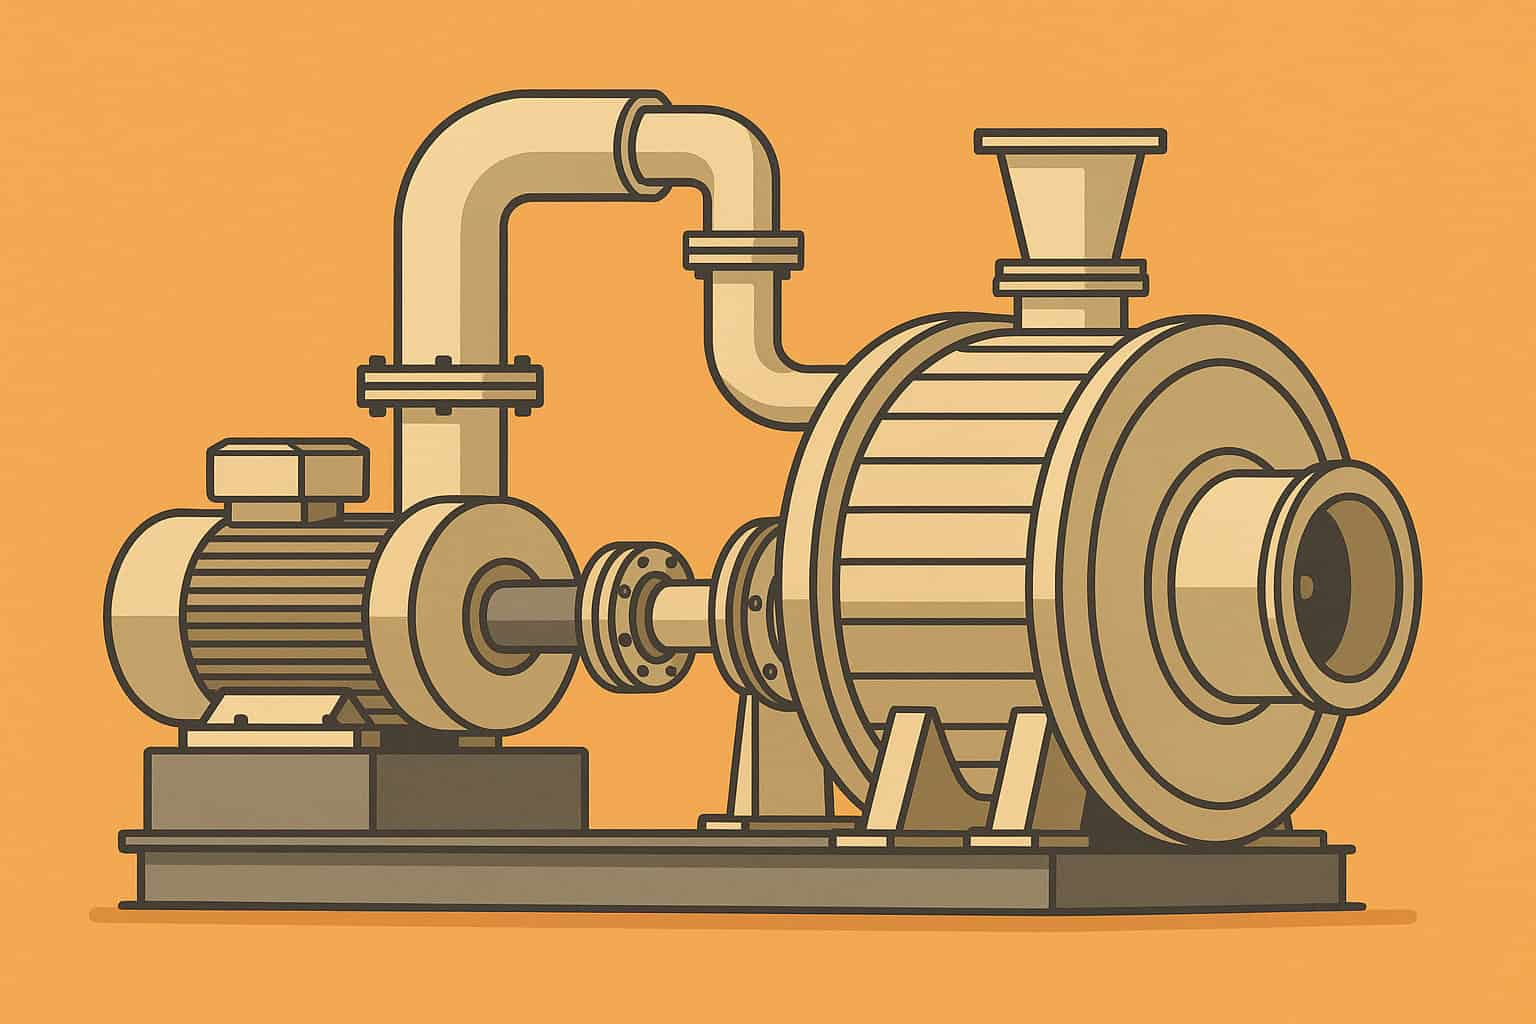

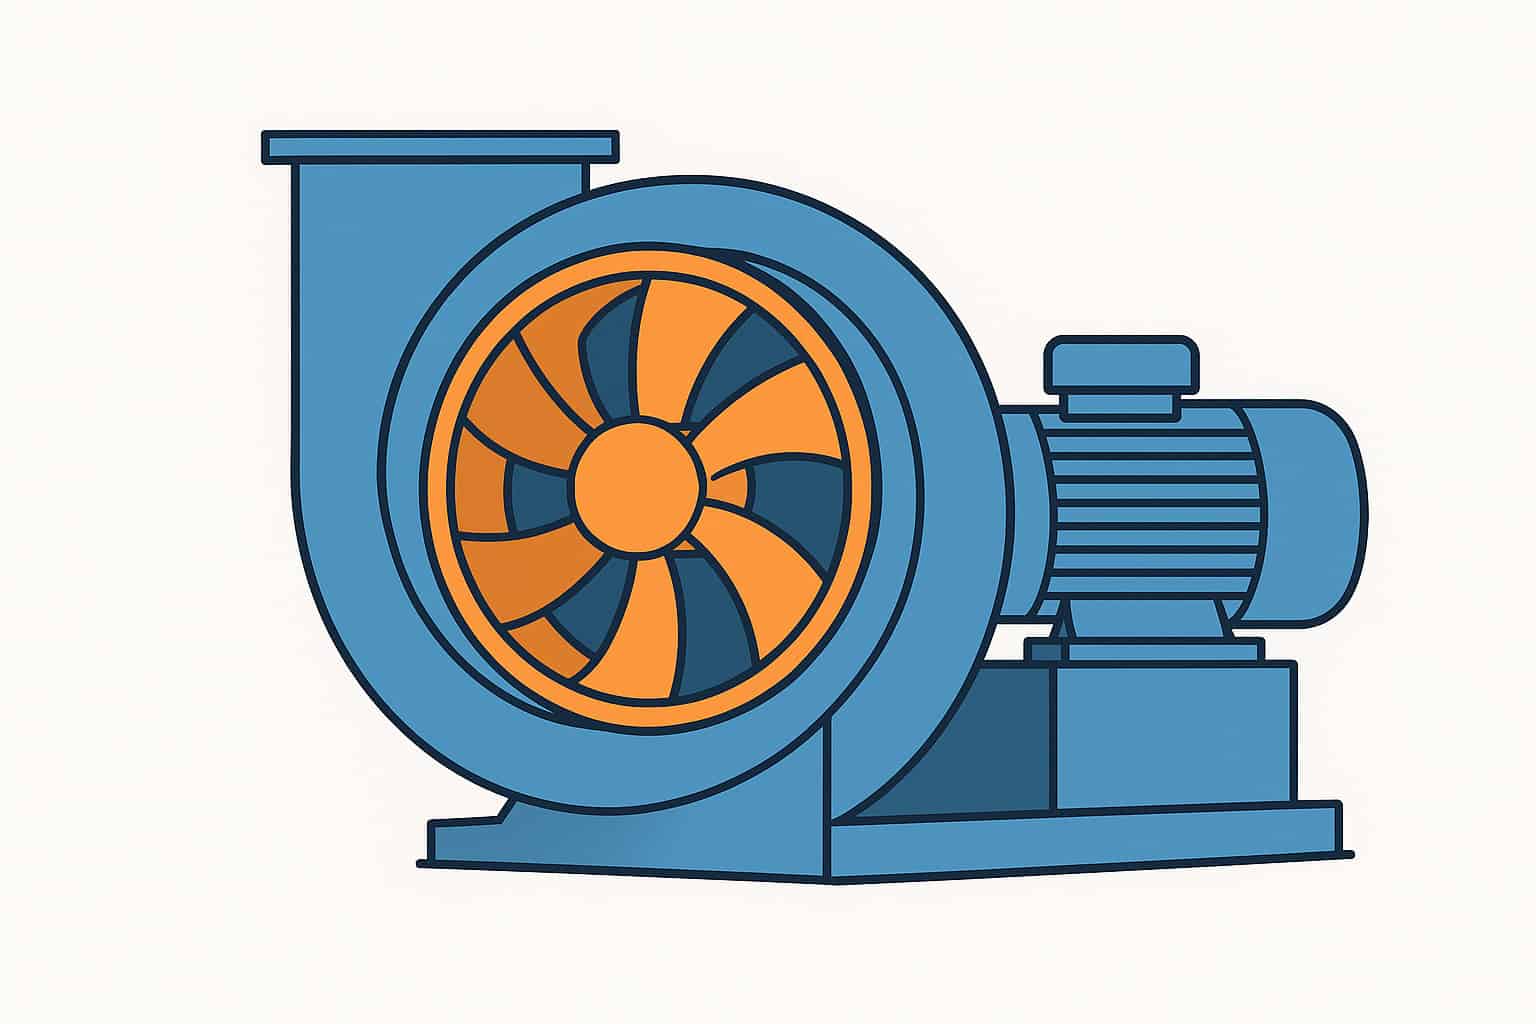

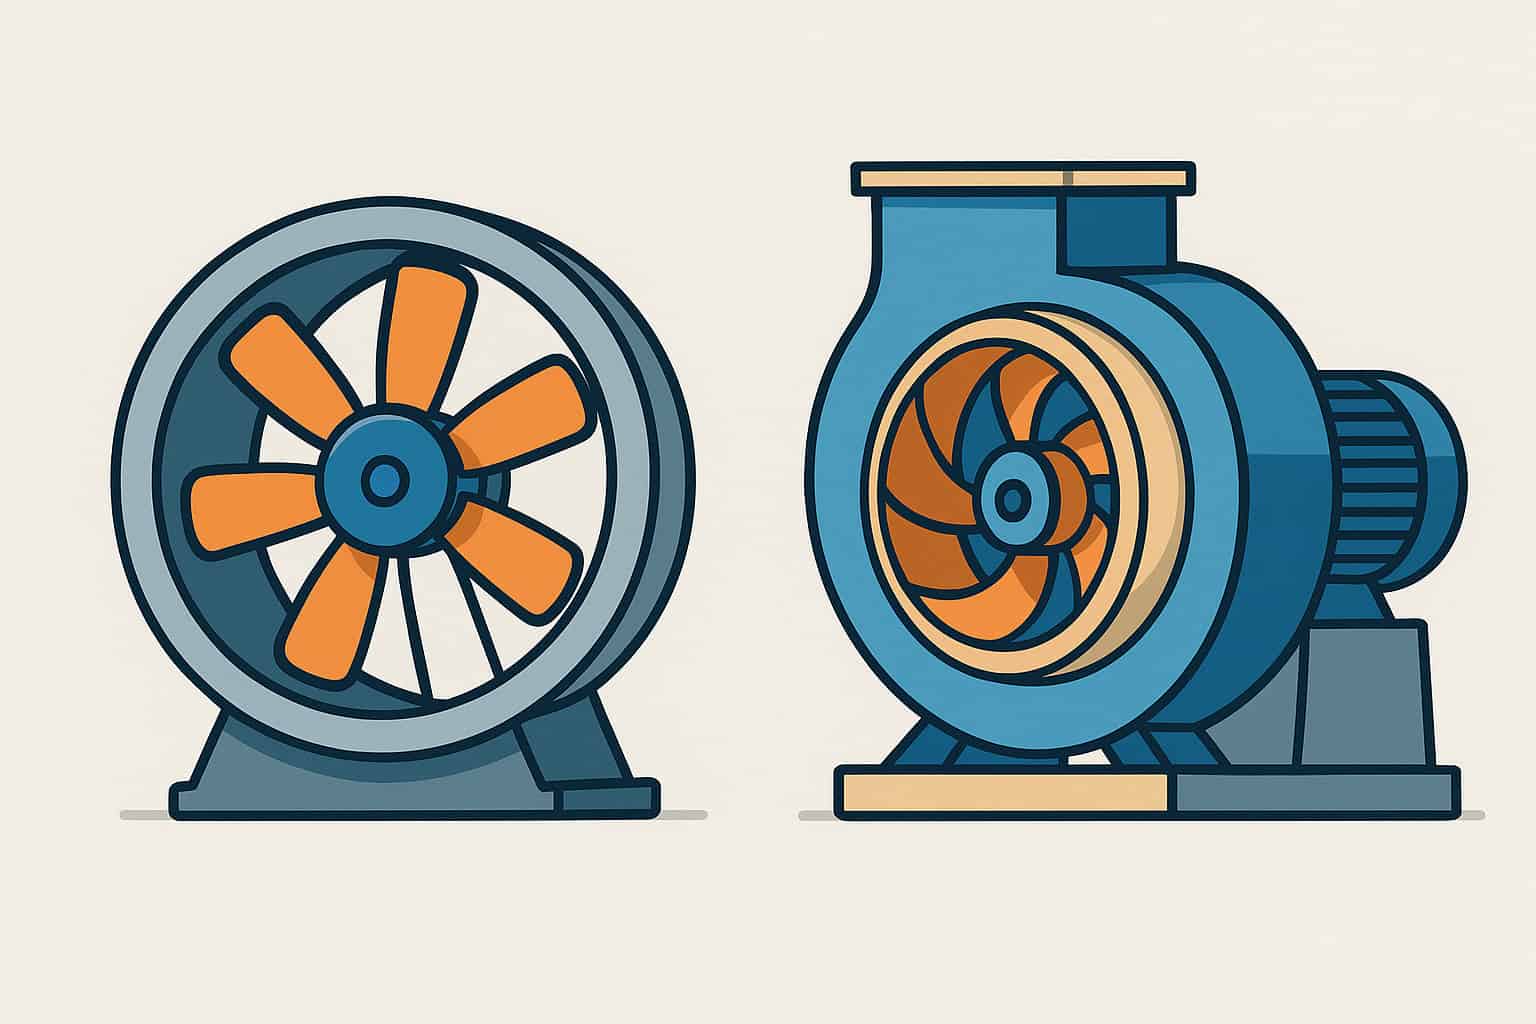
Learning how to study a fan curve is essential for anyone involved in selecting or troubleshooting ventilation fans in industrial plants and mines. A fan curve is a graphical summary of how a fan behaves, showing the relationship between airflow, pressure, power and efficiency at a given speed and air density. Once you know how to read it, you can quickly judge whether a fan is suitable for your system and how it will respond to changes in resistance.
Start by identifying the axes and units. The horizontal axis usually shows airflow (Q), expressed in m³/s or CFM. The primary vertical axis shows pressure (ΔP), expressed in Pa or inches of water gauge. On the same chart you will typically find additional curves: power input in kW or hp and efficiency in percent. Make sure you also note the fan speed, the air density or standard conditions, and whether the pressure shown is total or static.
Next, focus on the main pressure–flow curve. This curve shows how the fan’s developed pressure changes as airflow increases. As a rule, pressure decreases as flow increases. Studying this curve helps you understand how the fan reacts if your system resistance changes. For example, if dampers close or duct length increases, the system resistance curve becomes steeper and the operating point moves towards lower flow and higher pressure along the fan curve.
To fully study the curve, you should also look at the efficiency and power curves. The efficiency curve shows where the fan operates most efficiently; this is usually a broad peak in the mid-range of flows. The power curve tells you how much mechanical or electrical power the fan requires at each flow. When selecting a fan, you want your duty point to lie near the efficiency peak and within the allowable power and motor rating, so that the fan runs economically and without overload.
The most important step is to plot your system curve on the same graph, if possible. The system curve represents the pressure required by your ducts, filters, equipment or mine airways as a function of airflow. Where the system curve intersects the fan curve is the actual operating point. Studying how this intersection moves when system resistance changes (for example, as filters clog or mine development advances) gives you insight into how robust your fan selection is.
Finally, when studying a fan curve for mining or high-altitude applications, remember to apply density and speed corrections. Fan curves are usually given for standard air at a reference speed. If your site conditions differ significantly, convert your required duty to equivalent standard conditions before reading the curve, then convert back to actual conditions for pressure and power. By following these steps, you can study fan curves systematically and use them as powerful tools for designing and optimising ventilation systems.