


The PQ curve of a fan is the graph that shows the relationship between pressure (P) and airflow (Q) for that fan at a given speed. It is the core part of the fan performance chart and is essential for matching a fan to an industrial or mining ventilation system.
On a PQ curve, airflow (Q) is plotted along the horizontal axis, typically in m3/s or CFM, and pressure (P) is plotted on the vertical axis, usually as static pressure or total pressure in Pa or in.wg. Each point on the curve represents the pressure the fan can develop when operating at that particular airflow with a fixed rotational speed and air density.
At very low airflows, the fan is pushing against near-blocked conditions, so the PQ curve shows relatively high pressure at low flow. As the system resistance is reduced and airflow increases, the pressure usually rises to a peak and then gradually falls. Near the maximum flow, the fan can no longer develop much pressure, and the curve drops off towards zero pressure at free delivery. The exact shape depends on fan type and blade design.
The PQ curve is used together with the system curve, which describes how much pressure the system (ducts, filters, airways, etc.) requires at different flows. The intersection of the system curve and the fan PQ curve represents the operating point: here the fan’s available pressure equals the system’s required pressure, and the corresponding airflow is what the system will actually receive.
In addition to the main PQ curve, manufacturers often provide families of PQ curves for different speeds or impeller diameters. These curves are related by the fan affinity laws, which show how flow and pressure scale with speed. For fans driven by variable-frequency drives, PQ curves at different speeds help engineers understand how the operating point will shift as fan speed is adjusted to save energy or respond to changing ventilation demand.
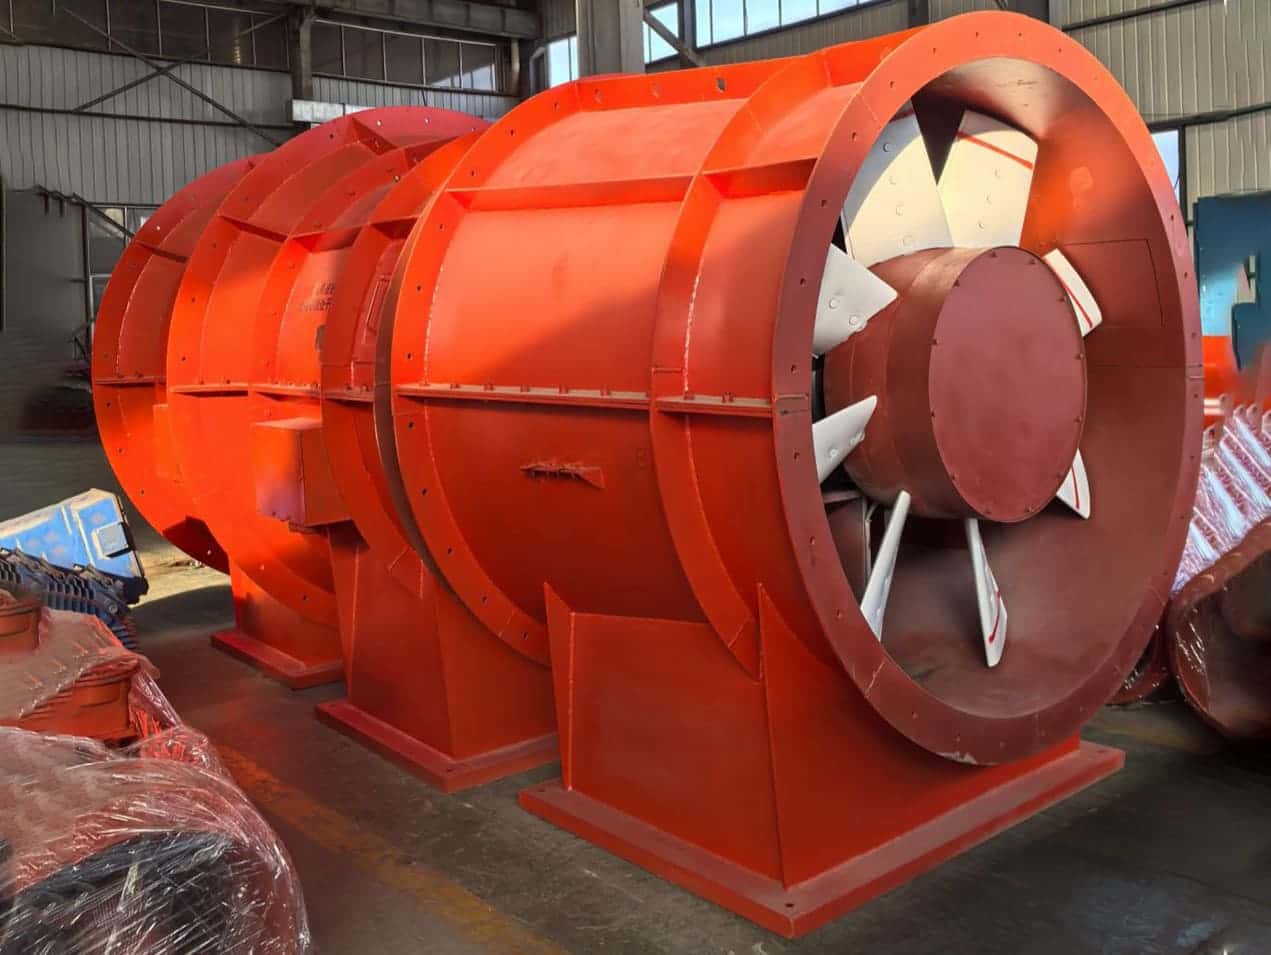
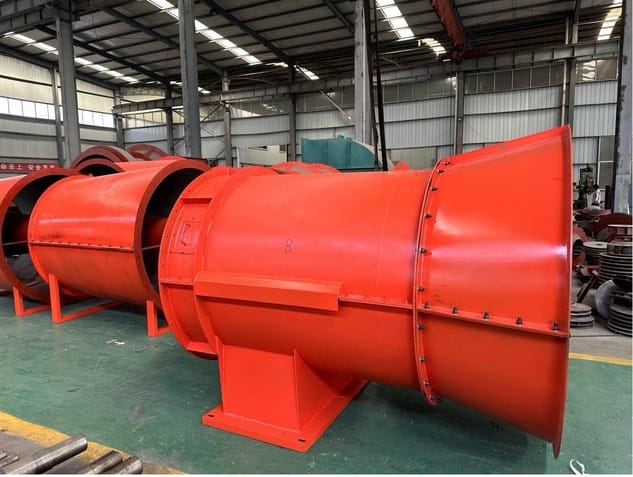
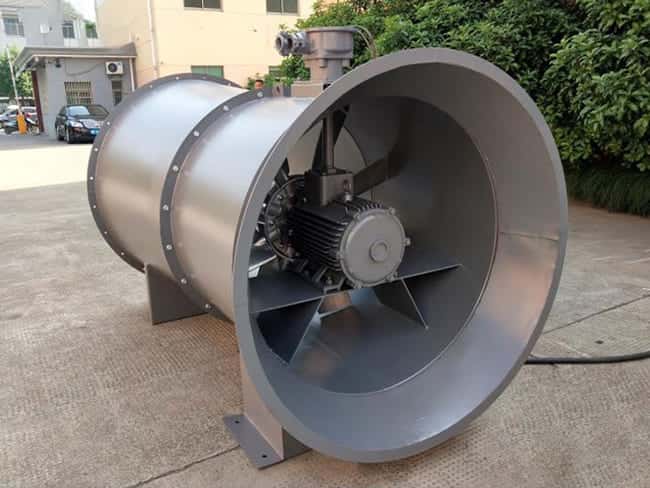
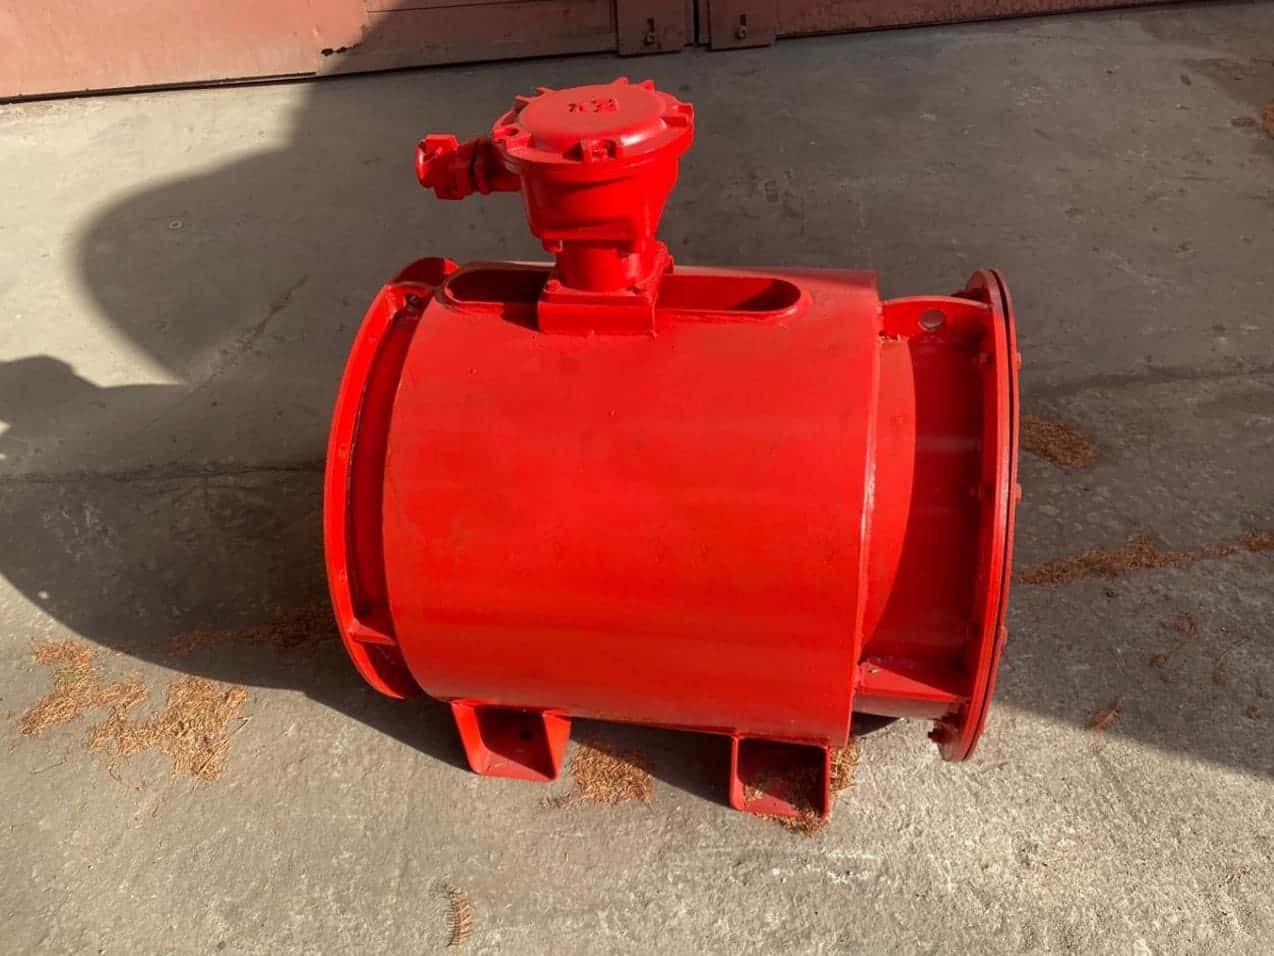
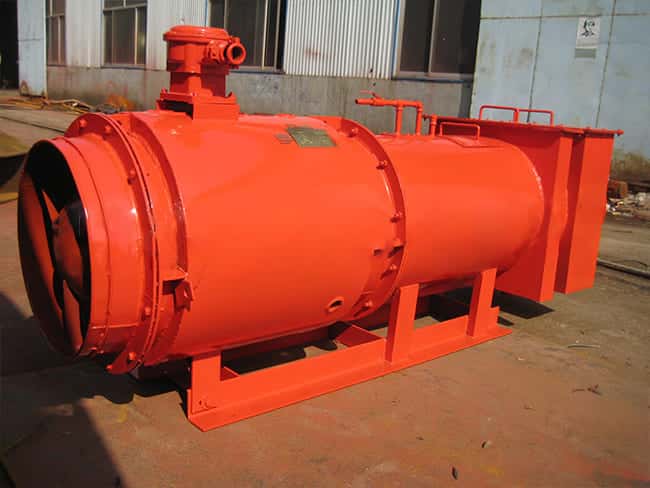
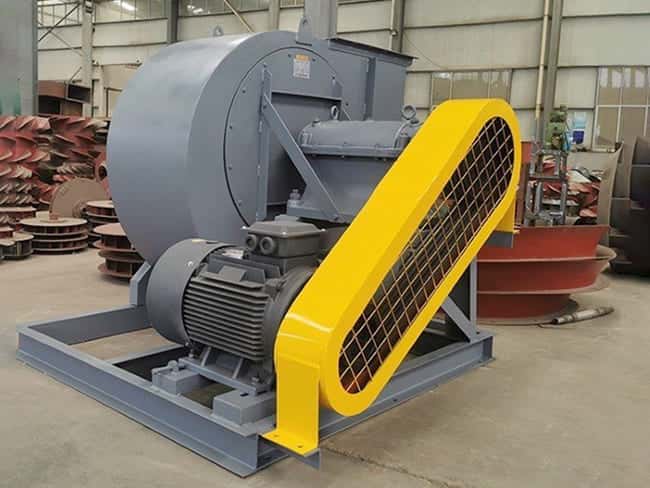
In mining ventilation, PQ curves are particularly important because long airways and regulators create significant resistance, and safety regulations specify minimum airflow at key locations. Selecting a fan without properly consulting its PQ curve can lead to under-ventilated headings or excessive energy use.
In summary, the PQ curve of a fan is the pressure–flow graph that shows how much pressure the fan can generate at each airflow value. It is the primary tool for matching fan performance to system resistance in industrial and mining ventilation design.